Dave-H
Content Type
Profiles
Forums
Events
Everything posted by Dave-H
-

[TOOL] POWIS - Powerful Windows Setup v1.0.3
Dave-H replied to George King's topic in Unattended Windows 10/11 Installation
@George King With respect, we should try to engage with fellow members here, not just have their content suppressed. I hope you can address @archlinuxuser's issues, by PM if necessary. If you can't, I will address this with them. -
Ublock Origin Lite (MV3) vs AdGuard MV3 Chromium Extensions
Dave-H replied to a topic in Web Browsers
Thank you! -
Ublock Origin Lite (MV3) vs AdGuard MV3 Chromium Extensions
Dave-H replied to a topic in Web Browsers
FWIW, I'm now using uBlock Origin Lite on Thorium and Supermium on XP, and Google Chrome 127 on Windows 10. Like a huge number of people, I always loved uBlock Origin, but it will be disabled on Chrome soon, as we all know. The Lite version seems to work fine, and blocks as many ads as the full version, as far as I can see. My one regret is that it doesn't have the function to block elements in a page, so I'm now having to let through a few banners and the like which I used to block. I think I can live with that though. Going back to Firefox isn't really an option for me, as there is no Firefox equivalent browser for XP which will sync with Firefox on Windows 10 and my phone. (I have to use Firefox on my phone as Android Chrome does not allow extensions, and using a browser with no blocker is an absolute no-no as far as I'm concerned!) -
Sorry for the delay, still been working on this! The trial version of Resource Tuner fixed the icons, thanks very much. I think I now have everything configured as it should be. Thorium is the default browser on XP, and seems to be performing fine.
-
FWIW, in the several years I've been using it, I don't think I've ever seen 360Chrome drop over to IE mode.
-
What is set as the Kernel Mode in the advanced settings? If it's on Automatic, try forcing it to Webkit mode.
-
I thought DefaultBrowser 1.8 was a good program too, I mentioned that the single click undo button particularly was good. Unfortunately, it didn't sort out my particular problem. Thanks for the information about the loader file, that explains it! I will try to do it with the latest Resource Hacker in Windows 10.
-
I did try DefaultBrowser 1.8, I reported back here that it didn't fix the problem. I've just spent the whole afternoon trying to track this problem down by process of elimination, which was very tedious! Finally, I've determined that it's due to the ancient 16 bit 'Run' program that I use as a program launcher. I never managed to get Thorium to run from it, and now I know why! 360Chrome won't run from it directly, but it will run from it using Launcher.exe to run its shortcut, but that doesn't work with Thorium. I have two 16 bit programs running on XP, the 'Run' program launcher, and an on-screen clock. I discovered that if they weren't launched, the problem went away and links from e-mails launched fine in Thorium. Running them brought the problem back. It now appears that I can run them, but the links only work from my e-mail program if I don't run it from the launcher. Running it from the launcher, which I've been doing for years, appears OK, but links then crash Thorium. Why this is happening, I have absolutely no idea! Just as an aside, how did you change the icon in the Thorium launcher program? I've tried doing it with Resource Hacker, but it won't work. I can replace the resource, but I can't then compile it or save it, everything is greyed out. Making other changes are fine, but not changing the icon.
-
Interesting conversation here since I last posted! My problem getting Thorium and Supermium to run correctly from links in documents is not resolved, but my great thanks go to @rereser who has given me an enormous amount of help with this via PM. The associated registry entries relevant to this were in a bit of a mess on my system, to put it mildly, but I think they are as they should be now! Two likely important things I have now determined. Firstly, the links are being passed correctly to Thorium, what is failing is the running of the browser from them. If I have Thorium already open, the links open in it perfectly, so that is a sort of workaround. I just have to remember to open Thorium first before I click on any links in e-mails! The other is that the problem goes away in Safe Mode. That to me would indicate that it's something that's running on the system which is causing the issue. I've already (I hope) eliminated Malwarebytes from blame, as the problem still happens with it shut down. In light of the previous conversation, I'm now scouring my System32\Drivers folders for unwanted obsolete driver files! Nothing found yet. I will carry on experimenting.
-
OK, back again, but no good news to report I'm afraid. I cleaned the registry of all the Thorium references, and then made Google Chrome 49 my default browser. It worked perfectly, opening HTM(L) files from Windows Explorer, and also opening links in documents correctly (apart from the intrinsic problems caused by its age of course). I then changed the path in HKEY_CLASSES_ROOT\https\shell\open\command to point to ThoriumLoader.exe instead of Chrome.exe (I have changed the name of the file again to match AstroSkipper's chosen name). No joy, Thorium still opened incorrectly. I then wondered if perhaps, as I hadn't installed Thorium in its default folder, maybe it didn't like that for some reason. So, I completely removed Thorium except for its User Data folder (I'm not setting all that up again if I can help it!) and re-installed it using its installation CMD file. This worked fine, I changed the paths in the loader INI file, and all was well, except that it still wouldn't open links correctly. I am going to leave its location as it is now. I then tried the same thing with Supermium, and I'm sure you won't be surprised to hear that it has exactly the same problem! I tried removing Supermium (again apart from the User Data folder) and re-installed it using its installation file, which I'd not actually used before. Again, it's working fine, but will not load links correctly. My finger of suspicion then moved to Malwarebytes Premium, as that has caused strange effects with some programs in the past due to its 'hardening' functions. Not guilty this time, the problem is still there with it not running. So, what now, this is a complete mystery to me. I guess I could ask the developers of Thorium and Supermium if they know what's happening here. Could someone else try this, putting a command line to run Thorium in HKEY_CLASSES_ROOT\https\shell\open\command and see if it works for you, on XP of course?
-
FWIW, it's always worked fine for me. I get a lot of pops and clicks, but that's expected. Volume I can adjust using WaveOut.exe. I have no sound in DOS games, but that's not a problem for me. There is no recording functionality, but I would have been really amazed if there had been! I've never had any system hangs which were knowingly due to the audio driver.
-
Thanks, it will be in a while now, but I will report back!
-
Thanks, I'll bear that in mind! I was just thinking that making another Chromium browser the default, even a very old one, would be a better starting point than doing it with Internet Explorer.
-
Thanks. What I was thinking of doing, as I still have Google Chrome 49 installed on the XP system, and it does have the mechanism to make it the default browser, is to try making that the default browser temporarily, check that works properly with links, and then go through the registry changing all of its entries to point to Thorium instead. Does that sound like a plan?
-
That's correct, no pages will open at all, even internal ones like settings. They just crash. Here's the registry keys' contents you asked for. Windows Registry Editor Version 5.00 [HKEY_CLASSES_ROOT\http] [HKEY_CLASSES_ROOT\http\AnimExtensions] "."="dxmasf.dll,150" ".asf"="dxmasf.dll,150" ".asp"="dxmasf.dll,150" ".asx"="dxmasf.dll,150" ".nsc"="dxmasf.dll,150" ".wax"="dxmasf.dll,150" ".wm"="dxmasf.dll,150" ".wma"="dxmasf.dll,150" ".wmv"="dxmasf.dll,150" ".wmx"="dxmasf.dll,150" ".wvx"="dxmasf.dll,150" [HKEY_CLASSES_ROOT\http\Extensions] ".mka"="{B98D13E7-55DB-4385-A33D-09FD1BA26338}" ".mkv"="{B98D13E7-55DB-4385-A33D-09FD1BA26338}" ".webm"="{B98D13E7-55DB-4385-A33D-09FD1BA26338}" ".mp4"="{B98D13E7-55DB-4385-A33D-09FD1BA26338}" ".mov"="{B98D13E7-55DB-4385-A33D-09FD1BA26338}" ".3gp"="{B98D13E7-55DB-4385-A33D-09FD1BA26338}" ".oga"="{B98D13E7-55DB-4385-A33D-09FD1BA26338}" ".ogg"="{B98D13E7-55DB-4385-A33D-09FD1BA26338}" ".ogm"="{B98D13E7-55DB-4385-A33D-09FD1BA26338}" ".ogv"="{B98D13E7-55DB-4385-A33D-09FD1BA26338}" ".ts"="{B98D13E7-55DB-4385-A33D-09FD1BA26338}" ".m2ts"="{B98D13E7-55DB-4385-A33D-09FD1BA26338}" [HKEY_CLASSES_ROOT\http\shell] [HKEY_CLASSES_ROOT\http\shell\open] [HKEY_CLASSES_ROOT\http\shell\open\command] @="\"D:\\Program Files\\Thorium\\ThorLoad.exe\" \"%1\"" [HKEY_CLASSES_ROOT\http\shell\open\ddeexec] [HKEY_CLASSES_ROOT\http\shell\open\ddeexec\Application] @="Thorium" [HKEY_CLASSES_ROOT\http\shell\open\ddeexec\Topic] @="WWW_OpenURL" Windows Registry Editor Version 5.00 [HKEY_CLASSES_ROOT\https] [HKEY_CLASSES_ROOT\https\shell] [HKEY_CLASSES_ROOT\https\shell\open] [HKEY_CLASSES_ROOT\https\shell\open\command] @="\"D:\\Program Files\\Thorium\\ThorLoad.exe\" \"%1\"" [HKEY_CLASSES_ROOT\https\shell\open\ddeexec] [HKEY_CLASSES_ROOT\https\shell\open\ddeexec\Application] @="Thorium" [HKEY_CLASSES_ROOT\https\shell\open\ddeexec\Topic] @="WWW_OpenURL" Windows Registry Editor Version 5.00 [HKEY_CLASSES_ROOT\ThoriumHTML\shell\open\command] @="\"D:\\Program Files\\Thorium\\ThorLoad.exe\" \"%1\"" Windows Registry Editor Version 5.00 [HKEY_LOCAL_MACHINE\SOFTWARE\Clients\StartMenuInternet\Thorium\shell\open\command] @="\"D:\\Program Files\\Thorium\\Chrome\\Application\\Thorium.exe\" \"%1\"" As you can see, I've called the loader file 'ThorLoad.exe'. This is its entry in StartMenuInternet. I didn't generate that, the system presumably did. It has no '%1' at the end for some reason. Windows Registry Editor Version 5.00 [HKEY_LOCAL_MACHINE\SOFTWARE\Clients\StartMenuInternet\ThorLoad.exe\shell\open\command] @="\"D:\\Program Files\\Thorium\\ThorLoad.exe\""
-
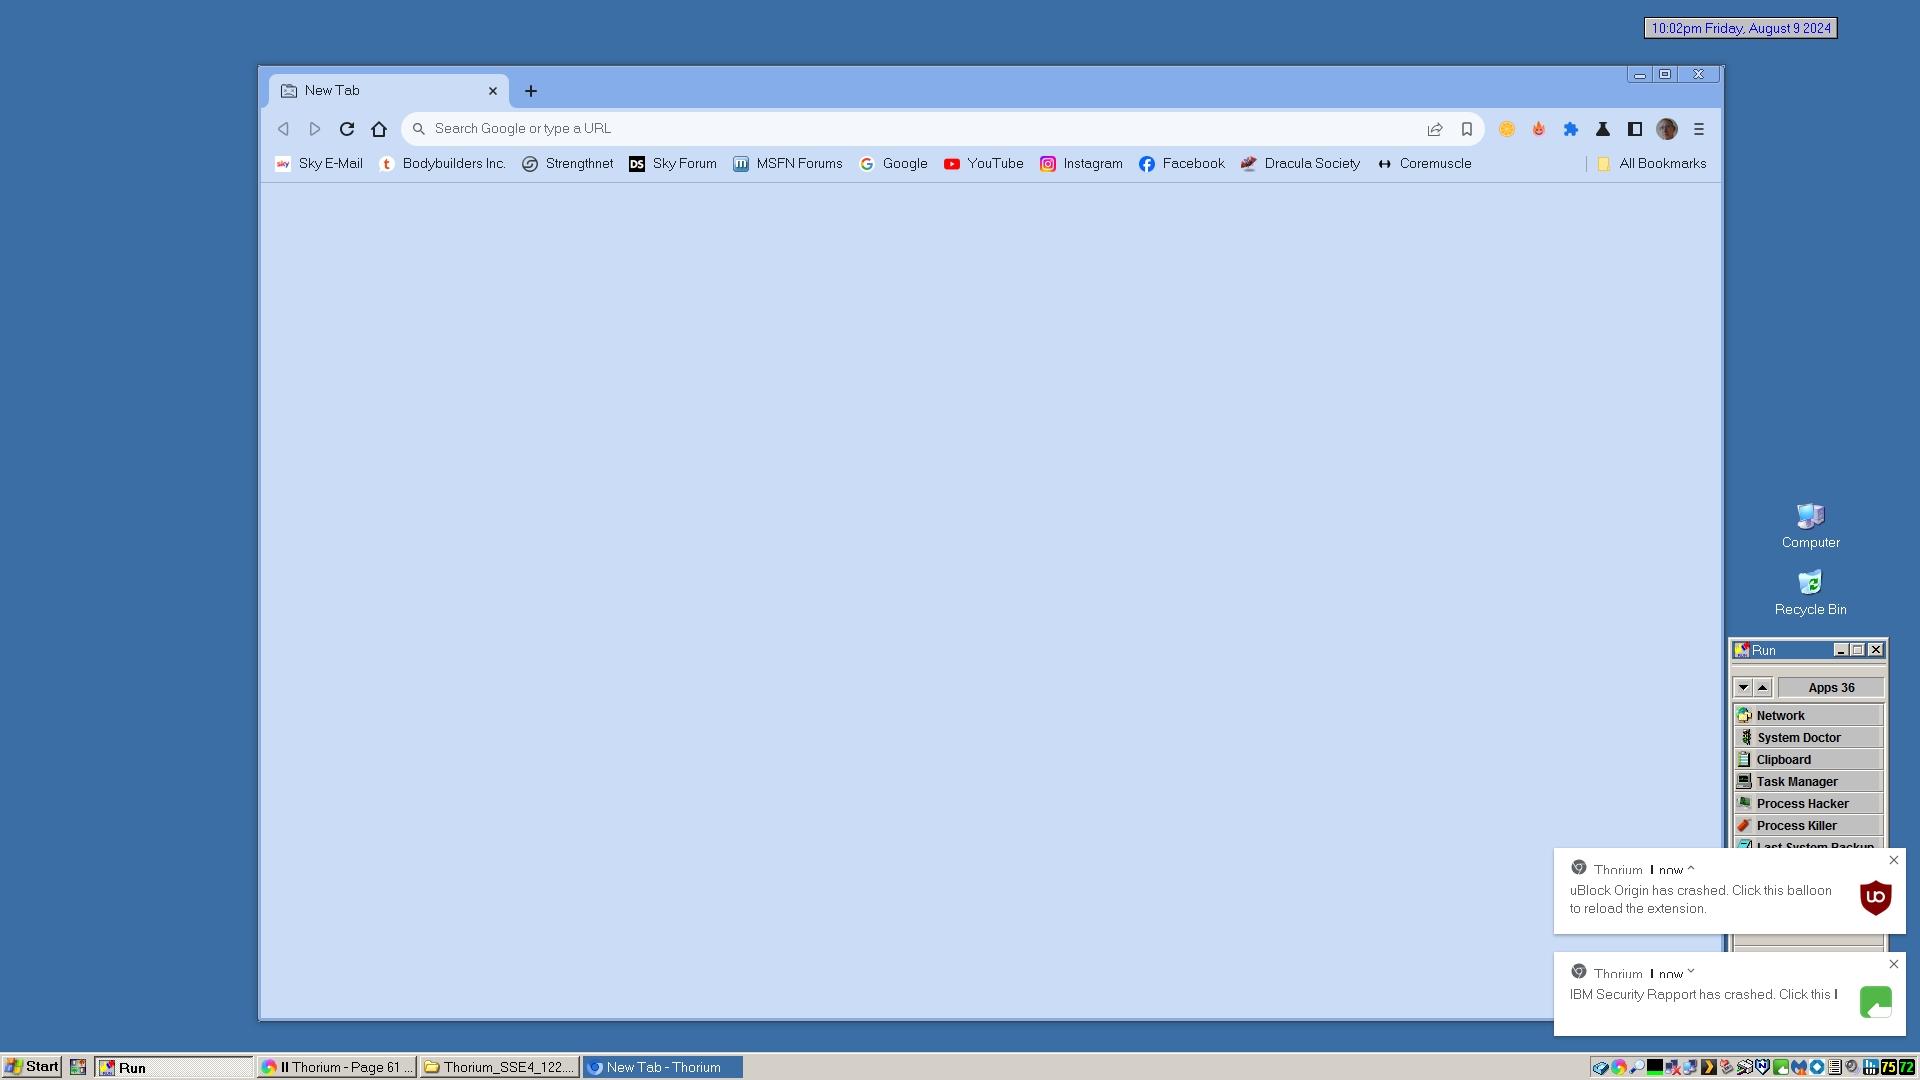
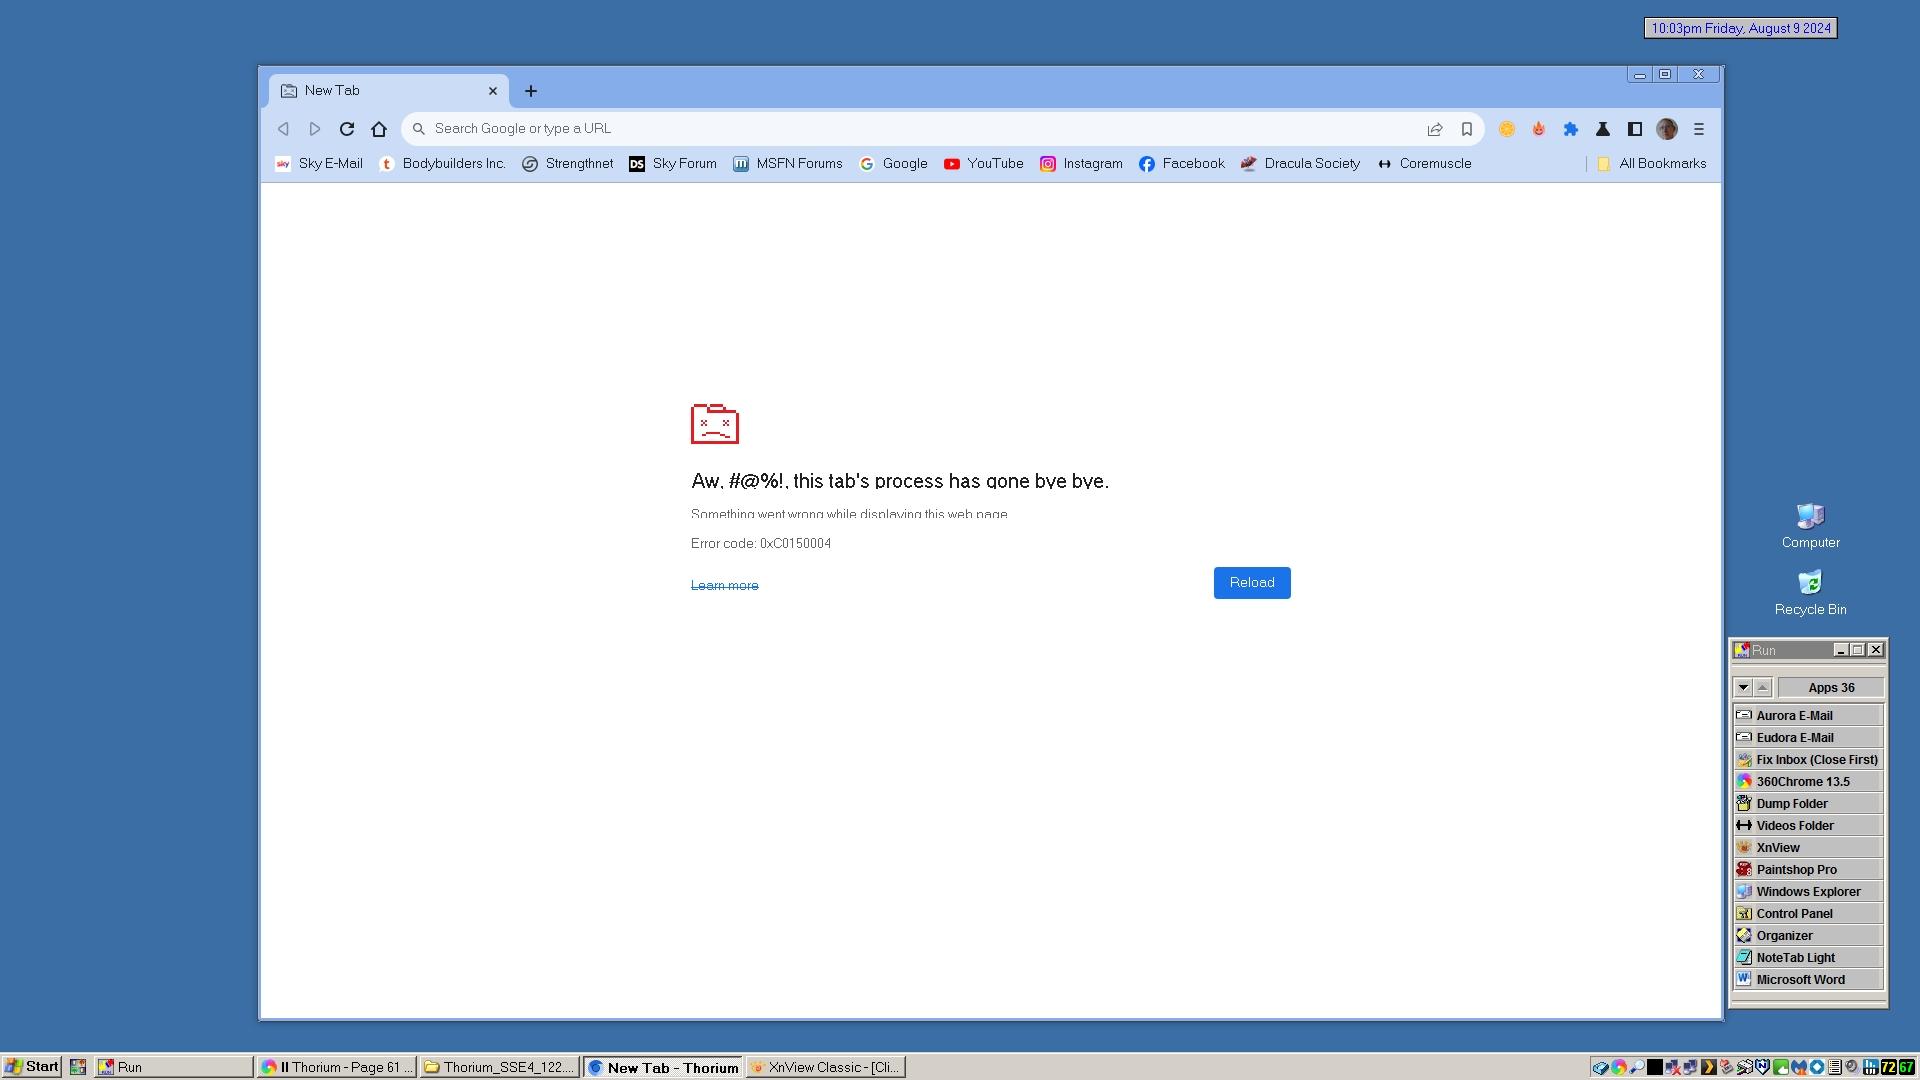
Ah, now I remember from the ProxHTTPSProxy testing! I tend to always put quotes around paths if they have spaces in them simply out of habit as you have to in Windows Explorer command lines. I've always assumed it's some ancient compatibility bug dating from DOS file names! I have found cases before where putting quotes around things actually stops them working though, especially in INI files. I've checked all the registry entries, and compared them with those in HKLM.reg and HKCR.reg supplied with Thorium, and all seems to match, other than the fact that I'm calling the loader, not Thorium.exe of course. All the file associations seem to be correct, and run Thorium correctly when used. What is not working is running Thorium from embedded links in documents. I can launch a PDF file, for instance, absolutely fine from the right click 'open with' dialogue, and it opens correctly in Thorium instead of my default PDF reader. However, if I launch a PDF document in the PDF reader, containing links, and then click on one of the links in the document, which worked fine in 360Chrome, it opens Thorium incorrectly. I get this - And if I try to open a page, even an internal one like the settings page, I get this - The registry entries which seem to determine what runs when a web link is licked, seem to be HKEY_CLASSES_ROOT\http and HKEY_CLASSES_ROOT\https. If I put the 360Chrome run command in the shell\open\command entry, 360Chrome opens links fine. If I put the Thorium loader command in the same place, it doesn't open Thorium properly. I really cannot understand why. I don't know how important the --single-argument switch is BTW. I tried adding it, and it made no difference.

-
Now I'm even more puzzled. The reason why the Profile= line entry didn't have quotes around it was because it didn't have quotes around it in the original 360Loader INI file. I've tried using your corrected code, and it doesn't work, Thorium runs but does not use the correct User Data folder, and creates a new one in D:\Program Files\Thorium\Chrome\Application\Default. It should be in D:\Program Files\Thorium\Chrome\User Data. And I'm sorry but I have no idea what the 'Space Bug' refers to! Sorry to be so thick.
-
OK, I'm back again, and would like to solve this annoying problem with running Thorium from links in documents. This is what I'm using in the loader INI file at the moment, [Setup] AppName=Thorium [FileToRun] PathToExe=.\Chrome\Application\$AppName$.exe Parameters=--user-data-dir="D:\Program Files\Thorium\Chrome\User Data" --no-proxy-server /high-dpi-support=1 /force-device-scale-factor=1 --disable-component-update--use-angle=d3d9 --ignore-gpu-blocklist [Environment] Profile=.\Chrome\User Data That works fine to run the browser with the correct parameters from a shortcut or command line, but not from a link in a document. I remember @AstroSkipper you were saying something about using a different method of defining the User Data folder location? I'm sorry, but I didn't really follow what you were suggesting.
-
Yes, I will keep on using Malwarebytes 3.5.1 until I think that the definitions it's using are too out of date to be effective protection. I'm open to suggestions for alternatives, I don't even mind paid options as long as the subscription is not too expensive. I would like to protect the XP installations on my main desktop and on my netbook. The one security program I never had any luck with in the past was Avast/AVG which I just could not get to work on my desktop (the main service refused to start, and the cause was never identified). I could try it again, and I do have an account with Avast (I use it on my smartphone). I don't know how usable it is on XP now though.
-
360 Extreme Explorer Modified Version
Dave-H replied to Humming Owl's topic in Browsers working on Older NT-Family OSes
Surely now you're much better off using Thorium or Supermium on XP. At least they're using relatively up-to-date Chromium versions. -
1.0.39678 is indeed the last pattern version I have. I too was very annoyed at the lack of notice of this. I always knew pattern update support would be ended at some point, of course, but always assumed we'd get at least a few weeks notice when it was about to happen. Just suddenly pulling the plug like that is very unprofessional in my opinion, especially for those like me who are still paying a subscription for the service!
-
The time has finally come. Definition updates for Malwarebytes Premium 3.5.1, the last XP compatible version, have finally ended. https://forums.malwarebytes.com/topic/315390-resolved-malwarebytes-351-not-updating-definitions-again/?do=findComment&comment=1653739
-
Thanks! I am about to go away for a few days, so I will have to take this further when I get back on Thursday evening. Cheers, Dave.
-
I'm not sure how to get that 'open with' context menu available on a link, but it certainly works fine with files in Windows Explorer. However, if there is a link to a file (or a web address) in an e-mail in my e-mail program, clicking on that opens Thorium incorrectly. The same happens with a link in a Word document or PDF file. The environment variable doesn't need to be there in the INI file of course, I was just slavishly copying the original file! The User Data folder path is of course in the switches. I will remove the [Environment] section.
-
Thanks @NotHereToPlayGames and @AstroSkipper. I am actually now using the loader file that came with 360Chrome to load Thorium, with a suitably edited INI file of course. [Setup] AppName=Thorium [FileToRun] PathToExe=.\Chrome\Application\$AppName$.exe Parameters=--user-data-dir="D:\Program Files\Thorium\Chrome\User Data" --no-proxy-server /high-dpi-support=1 /force-device-scale-factor=1 --disable-component-update --use-angle=d3d9 --ignore-gpu-blocklist --single-argument [Environment] Profile=.\Chrome\User Data It seems to work fine, and saves me having to append all the start-up switches to the command lines in the registry! Running it this way makes no difference to the problem though, a command line from the registry does not launch Thorium properly, but exactly the same command line in a shortcut or a 'run' command works fine! This is what I can't get my head around. I added the --single-argument switch to see if that made any difference, but it doesn't.