




Everything posted by Dietmar
-
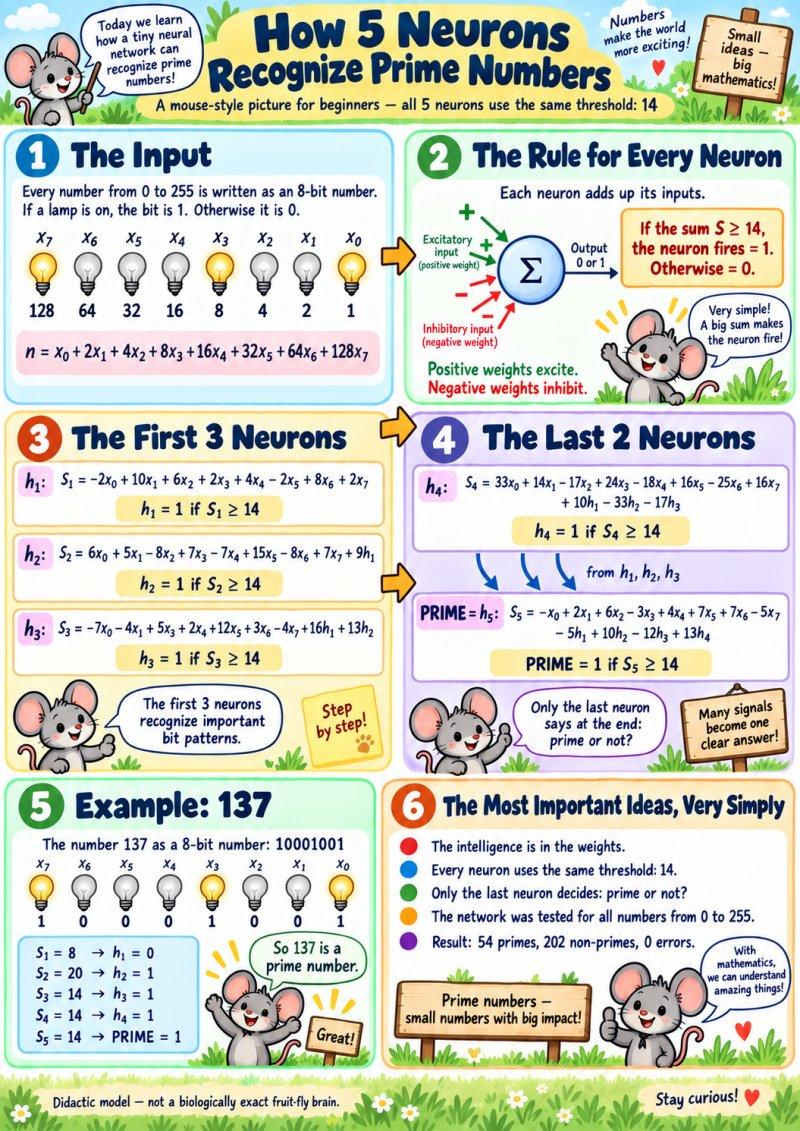
Hi, I succeed to rebuild this network, so that all Neurons switch now from 0 ==>1 for a common threshold >=14. The most interesting thing is, that the difference to normal neural network is, that jumps between neurons in different layers are now allowed Dietmar

-
Hi, eight input switches and five neurons. OFF = 0 ON = 1 The eight switches represent these values: Switch: x0 x1 x2 x3 x4 x5 x6 x7 Value: 1 2 4 8 16 32 64 128 Add the values of the switches that are ON. This gives the number to test. For example, switching ON 128, 8 and 1 gives: 128 + 8 + 1 = 137 This lets us enter every number from 0 to 255. What does a neuron do? It adds and subtracts the signals it receives. If the total reaches its threshold, it switches ON. Otherwise, it stays OFF. For example: 5*x1 means: Add 5 if switch x1 is ON. Add nothing if switch x1 is OFF. -4*x2 means: Subtract 4 if switch x2 is ON. Subtract nothing if switch x2 is OFF. The outputs of the five neurons are called h1, h2, h3, h4 and h5. They are always 0 or 1. Calculate the neurons in order: 1, 2, 3, 4, 5. Neuron 1 calculates: S1 = -x0 + 5*x1 + 3*x2 + x3 + 2*x4 - x5 + 4*x6 + x7 If S1 >= 7, then h1 = 1. Otherwise, h1 = 0. Neuron 2 also uses the result from Neuron 1: S2 = 2*x0 + x1 - 4*x2 + 3*x3 - 3*x4 + 7*x5 - 4*x6 + 3*x7 + 5*h1 If S2 >= 6, then h2 = 1. Otherwise, h2 = 0. Neuron 3 calculates: S3 = -3*x0 - 2*x1 + 2*x3 + x4 + 3*x5 + x6 - 2*x7 + 5*h1 + 6*h2 If S3 >= 4, then h3 = 1. Otherwise, h3 = 0. Neuron 4 calculates: S4 = 13*x0 + 4*x1 - 7*x2 + 9*x3 - 8*x4 + 6*x5 - 10*x6 + 6*x7 + 5*h1 - 13*h2 - 7*h3 If S4 >= 4, then h4 = 1. Otherwise, h4 = 0. Neuron 5 gives the final answer: S5 = 2*x1 + 6*x2 - 3*x3 + 4*x4 + 4*x5 + 7*x6 - 5*x7 - 5*h1 + 10*h2 - 9*h3 + 13*h4 If S5 >= 15, then h5 = 1: PRIME. Otherwise, h5 = 0: NOT PRIME. Here, * means multiplication and >= means “greater than or equal to”. Reaching the threshold exactly is enough to switch ON. A neuron passes only its ON/OFF result to the next neurons. For example, if Neuron 2 has a total of 8, its output is h2 = 1, not 8. For our example, 137: Neuron: 1 2 3 4 5 Output: 0 1 0 1 1 The last neuron is ON, so 137 is prime. For 169: Neuron: 1 2 3 4 5 Output: 0 1 1 1 0 The last neuron is OFF, so 169 is not prime. Indeed, 169 = 13*13. All 256 possible inputs were tested: 54 primes, 202 non-primes, zero errors. The network also correctly handles 0, 1 and 2. There are five neurons in total, including the final output neuron. Dietmar
-
@xper Can you please enable, that my prim.html is clickable and can be seen at once, direct in my post? It would be really crazy nice Dietmar
-
Hi, I build with the neuron from Drosophila a network, that can recognice prime numbers with 5 neurons up to 255 in binary notation Dietmar prim.html
-
@reboot12 It is v117.0a1 (32-bit) Compiled on 2026/08/21 https://github.com/e3kskoy7wqk/Firefox-for-windows-7-REWORK/releases/expanded_assets/debug Dietmar
-
@Damnation Hi, just now my card from Ali Express arrives. https://www.aliexpress.com/item/1005012704088998.html A first test with XP SP3, Ubuntu and win10 shows, that from Sata you cant boot, just see a blinking cursor, even the Sata AHCI is shown as bootable device in Bios. I will check, what happens Dietmar PS: @xper I have also this problem, that I cant mark a text here for to copy with MyPal browser on XP SP3. But with Thorium, Chrome and the Nightly build of Firefox I can. And I noticed another strange thing: When I edit my post here, I can see this edit only with that Browser, with which I edit my post.
-
@Damnation I just ordered also one just now, soon fun starts, hope, that it is not blocked by the street of Hormus Dietmar
-
@Damnation How and where you bought this PCI-e adapter, I am interested too Dietmar
-
@Damnation Do you make already some tests with this PCI-E card from https://www.youtube.com/watch?v=6fSLN-Fk7VE Dietmar
-
@Damnation In the video they tell, that the M.2 slot on this card is bootable, but the Sata slots not. But I think, it depends on the hardware of your compi and the Bios. A try with Linux can help a lot, because IF it is bootable, Linux will boot Dietmar
-
@Damnation AGP Texture Acceleration = Not Available is normal with Intel 14.x XP drivers, so also for the 5445. Intel reports the graphics memory as local video memory, so DXDiag does not expose the old AGP/non-local texture path. For to modd the 5449 I have no mood Dietmar
-
Yessssssaaaaaaaaaaa!!!!!!!!!!! Dietmar https://www.upload.ee/files/19651199/igxpmp32_5445_CF53_DEV_0A16_PPS5_NULLGUARD3_TEST.sys.html I get 15781 points in 3DMark2001 Panasonic Toughbook CF-53 Mk4 – Intel HD 4400 DEV_0A16 under Windows XP SP3 I finally have the Intel 5445 XP graphics driver running on my Panasonic Toughbook CF-53 Mk4 with the Haswell-U Intel HD 4400 (PCI\VEN_8086&DEV_0A16). This was debugged live with WinDbg over KDNET. The original Intel 5445 driver installs normally, but after reboot it crashes exactly like the system tested by @Damnation. Hardware / software Panasonic Toughbook CF-53 Mk4 Intel Core i5-4310U Intel HD Graphics 4400 PCI Device ID: 8086:0A16 Windows XP SP3 32-bit Intel XP graphics driver 6.14.10.5445 Kernel debugging via WinDbg/KDNET The unmodified 5445 driver installed without any problem. On the first reboot, however, XP produced: PAGE_FAULT_IN_NONPAGED_AREA BugCheck 50 Arg1: F000EEF3 Arg2: 00000000 Arg3: F000EEF3 Arg4: 00000002 WinDbg initially reported: Probably caused by : igxpmp32.sys The stack clearly went through igxpmp32.sys. The interesting detail was that both the referenced address and instruction address were: F000EEF3 1. Finding the real cause of BSOD 0x50 Initially I suspected a bad Haswell-ULT MMIO access. We traced one suspicious Intel register read of offset: 0x64440 The live call was: Context = 8A50F350 MMIO base = B8BFE000 B8BFE000 + 64440 = B8C62440 Immediately before the read: ESI = B8C62440 EDI = B9B265A8 ECX = 00000001 The actual Windows function was: nt!READ_REGISTER_BUFFER_ULONG and the read completed successfully. The returned value was simply: 00000000 So the 0x64440 MMIO access was not the source of the 0x50. The important discovery came later. In igxpmp32 we reached: igxpmp32+171850: mov eax,[igxpmp32+26601C] push eax mov ecx,[igxpmp32+26601C] call dword ptr [ecx+90h] The global object pointer was: [igxpmp32+26601C] = 00000000 Therefore: ECX = 00000000 Immediately before the crash we confirmed live: call dword ptr [ecx+90h] with: ECX = 00000000 Then: dd ecx+90 L1 00000090 f000eef3 This explains the original BSOD completely. The Intel driver was effectively doing: ECX = NULL CALL DWORD PTR [NULL + 0x90] [00000090] = F000EEF3 CPU executes CALL F000EEF3 => PAGE_FAULT_IN_NONPAGED_AREA 0x50 So F000EEF3 was not a mysterious GPU MMIO address. It came directly from low memory at address 0x90. We first tested the workaround manually by skipping the call and forcing: AL = 0 The function returned cleanly. We then replaced the six-byte call in RAM: Original: FF 91 90 00 00 00 call dword ptr [ecx+90h] Temporary patch: 33 C0 90 90 90 90 xor eax,eax nop nop nop nop This eliminated the original BSOD 0x50. 2. After fixing 0x50: BSOD 0xEA With the first fix applied, the driver progressed considerably further, but Windows then hit: THREAD_STUCK_IN_DEVICE_DRIVER BugCheck EA The new stack led us into: igxpmp32+175871 The driver was polling register: 0xC7200 The loop was: mov edx,[ebp-4] shr edx,1Ch and edx,3 cmp edx,1 je retry mov eax,[ebp-4] shr eax,1Fh and eax,1 je retry The value returned for C7200 was: 00000000 so the loop could never terminate. The interesting part was the Intel internal register-descriptor table. It contained 21 entries. The last five registers were: 61200 61204 61208 6120C 61210 There was no C7200 entry. The complete five-register sequence was therefore: 61200 61204 61208 6120C 61210 while the Haswell/PCH panel-power code was requesting: C7200 C7204 C7208 C720C C7210 This looked extremely suspicious. The internal read routine searched its table for the requested register. If no matching entry existed, it simply returned FALSE and left the supplied DWORD unchanged at zero. Therefore the sequence was: request C7200 | v C7200 not present in internal table | v read routine returns FALSE | v output remains 00000000 | v polling code waits forever | v 0xEA watchdog 3. First PPS test: 61200 -> C7200 We changed the first table entry temporarily in RAM: 61200 -> C7200 Immediately afterward the exact same read returned: C7200 = 80000008 instead of zero. This was a major confirmation. The polling conditions were now satisfied: Bit 31 = 1 Bits 29:28 = 00 The driver exited the first polling loop. So the register-table mismatch was real. 4. Complete panel-power register patch The driver later accesses the complete PPS register set, so we changed all five table keys: 61200 -> C7200 61204 -> C7204 61208 -> C7208 6120C -> C720C 61210 -> C7210 Together with the original NULL-call patch, XP now progressed far enough that I could see the Windows XP desktop for approximately one second. That was the first time the Intel 5445 driver actually reached visible accelerated graphics initialization on this Panasonic. However, another problem appeared afterward. 5. Third bug: another NULL object dereference After progressing beyond the PPS problem we caught a second-chance exception: Access violation - code C0000005 igxpmp32+16F1AF: cmp edx,dword ptr [ecx+68h] WinDbg showed: Attempt to read from address 00000068 and: ECX = 00000000 So this was another straightforward NULL-pointer dereference. The relevant routine searches several objects. The normal object list contained four entries. Their field +68h values were: 00000006 00000007 00000008 00000005 The requested value was: FFFFFFFF Therefore there was correctly no match in the normal list. The function then uses an optional fallback object: movzx edx,byte ptr [object+54h] test edx,edx je no_fallback mov ecx,[object+58h] mov edx,[ebp+0Ch] cmp edx,[ecx+68h] The live object contained: [object+54h] = 00000001 [object+58h] = 00000000 In other words: fallback-present flag = TRUE fallback pointer = NULL The driver therefore executed: cmp edx,[NULL+68h] and crashed. The correct behavior if the fallback does not exist is simply to return NULL, because that is exactly what the function already does when the fallback does not match. So a NULL guard was added: fallback = object->fallback; if (fallback == NULL) return NULL; if (fallback->field68 != requested) return NULL; return fallback; 6. Final patch set The currently working experimental 5445 driver therefore contains three fixes. Fix 1 – initial 0x50 Prevent: call dword ptr [NULL+90h] at the path around: igxpmp32+171867 The failed call is replaced by a FALSE return: xor eax,eax nop nop nop nop Fix 2 – Haswell/PCH panel-power register mapping Internal PPS table: 61200 -> C7200 61204 -> C7204 61208 -> C7208 6120C -> C720C 61210 -> C7210 Fix 3 – missing fallback NULL check Around: igxpmp32+16F1A9 the fallback object obtained from [object+58h] must be checked against NULL before dereferencing [fallback+68h]. Result With these three modifications the behavior changed from: install Intel 5445 reboot immediate BSOD 0x50 / F000EEF3 to a system that progresses through the Intel HD 4400 initialization and reaches the Windows XP desktop. Most importantly, the original mysterious: F000EEF3 has now been completely explained. It comes from: NULL object -> [NULL+90h] -> DWORD at physical/low virtual address 00000090 -> F000EEF3 -> CALL F000EEF3 -> BSOD 0x50 The subsequent 0xEA also had a concrete explanation: the 5445 driver was looking for the Haswell panel-power register C7200, while the selected internal descriptor table contained the older/different 61200 PPS register set. Finally, once those problems were bypassed, another missing object initialization became visible and required a simple NULL guard. So the important conclusion is: DEV_0A16 itself is not fundamentally incompatible with the XP 5445 driver. The driver already contains a large amount of the required Haswell support, but on this Panasonic/Haswell-U path several initialization assumptions are wrong: an object used by the +171850 path is NULL, the wrong PPS register descriptor set is selected, another optional fallback object is marked present although its pointer is NULL.
-
@Damnation After install of XP SP3, I make a full USB-bootable copy to USB Kingston stick with AOMEI. This helps, to put the original install always back to the beginning. Then I set up the Lan Windbg for Intel. I do not install the Lan driver i218-LM for this. Here is the result, exakt as for you Bsod 0x50 after reboot of the Intel graphik 5445 driver. Dietmar Microsoft (R) Windows Debugger Version 6.3.9600.17200 X86 Copyright (c) Microsoft Corporation. All rights reserved. Using NET for debugging Opened WinSock 2.0 Waiting to reconnect... Connected to target 192.168.2.110 on port 50000 on local IP 192.168.2.102. Connected to Windows XP 2600 x86 compatible target at (Sat Aug 15 13:31:43.328 2026 (UTC + 2:00)), ptr64 FALSE Kernel Debugger connection established. ************* Symbol Path validation summary ************** Response Time (ms) Location OK C:\Symbols ************* Symbol Path validation summary ************** Response Time (ms) Location OK C:\symbolssss Symbol search path is: C:\symbolssss Executable search path is: C:\Symbols *** ERROR: Symbol file could not be found. Defaulted to export symbols for ntkrpamp.exe - Windows XP Kernel Version 2600 MP (1 procs) Free x86 compatible Built by: 2600.xpsp_sp3_qfe.180912-0606 Machine Name: Kernel base = 0x804d7000 PsLoadedModuleList = 0x8055d720 System Uptime: not available ************* Symbol Path validation summary ************** Response Time (ms) Location Deferred srv* ************* Symbol Path validation summary ************** Response Time (ms) Location OK C:\Symbols ************* Symbol Path validation summary ************** Response Time (ms) Location OK C:\symbolssss Opened log file 'C:\dark11_kdlog_065c_2026-06-15_10-09-43-000.txt' Break instruction exception - code 80000003 (first chance) nt!DbgBreakPoint: 8052b718 cc int 3 kd> g Unload module Fdc.SYS at b9bd0000 Unload module Sfloppy.SYS at b930e000 Unload module Cdaudio.SYS at b9bd8000 Unload module DumpDrv.SYS at b8ef3000 Unload module igxprd32.dll at be812000 Unload module vga.dll at bff50000 Unload module igxprd32.dll at be812000 *** Fatal System Error: 0x00000050 (0xF000EEF3,0x00000000,0xF000EEF3,0x00000002) Break instruction exception - code 80000003 (first chance) A fatal system error has occurred. Debugger entered on first try; Bugcheck callbacks have not been invoked. A fatal system error has occurred. Connected to Windows XP 2600 x86 compatible target at (Sat Aug 15 13:32:02.046 2026 (UTC + 2:00)), ptr64 FALSE *** ERROR: Symbol file could not be found. Defaulted to export symbols for ntkrpamp.exe - Loading Kernel Symbols ............................................................... ..................................................... Loading User Symbols ............. Loading unloaded module list ..... ************* Symbol Loading Error Summary ************** Module name Error ntkrpamp The system cannot find the file specified You can troubleshoot most symbol related issues by turning on symbol loading diagnostics (!sym noisy) and repeating the command that caused symbols to be loaded. You should also verify that your symbol search path (.sympath) is correct. ******************************************************************************* * * * Bugcheck Analysis * * * ******************************************************************************* Use !analyze -v to get detailed debugging information. BugCheck 50, {f000eef3, 0, f000eef3, 2} ***** Kernel symbols are WRONG. Please fix symbols to do analysis. *** ERROR: Module load completed but symbols could not be loaded for mssmbios.sys *** ERROR: Module load completed but symbols could not be loaded for igxpmp32.sys *** ERROR: Symbol file could not be found. Defaulted to export symbols for VIDEOPRT.SYS - *** ERROR: Symbol file could not be found. Defaulted to export symbols for win32k.sys - *** ERROR: Symbol file could not be found. Defaulted to export symbols for igxpgd32.dll - *** ERROR: Module load completed but symbols could not be loaded for igxprd32.dll ************************************************************************* *** *** *** *** *** Your debugger is not using the correct symbols *** *** *** *** In order for this command to work properly, your symbol path *** *** must point to .pdb files that have full type information. *** *** *** *** Certain .pdb files (such as the public OS symbols) do not *** *** contain the required information. Contact the group that *** *** provided you with these symbols if you need this command to *** *** work. *** *** *** *** Type referenced: nt!_KPRCB *** *** *** ************************************************************************* ************************************************************************* *** *** *** *** *** Your debugger is not using the correct symbols *** *** *** *** In order for this command to work properly, your symbol path *** *** must point to .pdb files that have full type information. *** *** *** *** Certain .pdb files (such as the public OS symbols) do not *** *** contain the required information. Contact the group that *** *** provided you with these symbols if you need this command to *** *** work. *** *** *** *** Type referenced: nt!_KPRCB *** *** *** ************************************************************************* *** ERROR: Symbol file could not be found. Defaulted to export symbols for KERNEL32.dll - ************* Symbol Loading Error Summary ************** Module name Error KERNEL32 PDB not found : c:\symbolssss\symbols\dll\kernel32.pdb You can troubleshoot most symbol related issues by turning on symbol loading diagnostics (!sym noisy) and repeating the command that caused symbols to be loaded. You should also verify that your symbol search path (.sympath) is correct. Probably caused by : igxpmp32.sys ( igxpmp32+1df9e ) Followup: MachineOwner --------- nt!DbgBreakPointWithStatus+0x4: 8052b724 cc int 3 0: kd> !analyze -v ******************************************************************************* * * * Bugcheck Analysis * * * ******************************************************************************* PAGE_FAULT_IN_NONPAGED_AREA (50) Invalid system memory was referenced. This cannot be protected by try-except, it must be protected by a Probe. Typically the address is just plain bad or it is pointing at freed memory. Arguments: Arg1: f000eef3, memory referenced. Arg2: 00000000, value 0 = read operation, 1 = write operation. Arg3: f000eef3, If non-zero, the instruction address which referenced the bad memory address. Arg4: 00000002, (reserved) Debugging Details: ------------------ ***** Kernel symbols are WRONG. Please fix symbols to do analysis. ************************************************************************* *** *** *** *** *** Your debugger is not using the correct symbols *** *** *** *** In order for this command to work properly, your symbol path *** *** must point to .pdb files that have full type information. *** *** *** *** Certain .pdb files (such as the public OS symbols) do not *** *** contain the required information. Contact the group that *** *** provided you with these symbols if you need this command to *** *** work. *** *** *** *** Type referenced: nt!_KPRCB *** *** *** ************************************************************************* ************************************************************************* *** *** *** *** *** Your debugger is not using the correct symbols *** *** *** *** In order for this command to work properly, your symbol path *** *** must point to .pdb files that have full type information. *** *** *** *** Certain .pdb files (such as the public OS symbols) do not *** *** contain the required information. Contact the group that *** *** provided you with these symbols if you need this command to *** *** work. *** *** *** *** Type referenced: nt!_KPRCB *** *** *** ************************************************************************* ADDITIONAL_DEBUG_TEXT: You can run '.symfix; .reload' to try to fix the symbol path and load symbols. FAULTING_MODULE: 804d7000 nt DEBUG_FLR_IMAGE_TIMESTAMP: 52491c0a READ_ADDRESS: unable to get nt!MmSpecialPoolStart unable to get nt!MmSpecialPoolEnd unable to get nt!MmPagedPoolEnd unable to get nt!MmNonPagedPoolStart unable to get nt!MmSizeOfNonPagedPoolInBytes f000eef3 FAULTING_IP: +21fd860021fd880 f000eef3 ?? ??? MM_INTERNAL_CODE: 2 DEFAULT_BUCKET_ID: DRIVER_FAULT BUGCHECK_STR: 0x50 ANALYSIS_VERSION: 6.3.9600.17237 (debuggers(dbg).140716-0327) x86fre LAST_CONTROL_TRANSFER: from 804f9a80 to 8052b724 FAILED_INSTRUCTION_ADDRESS: +21fd860021fd880 f000eef3 ?? ??? STACK_TEXT: WARNING: Stack unwind information not available. Following frames may be wrong. b9b26100 804f9a80 00000003 c0603c00 c0780070 nt!DbgBreakPointWithStatus+0x4 b9b264e0 804f9fcf 00000050 f000eef3 00000000 nt!KeRegisterBugCheckReasonCallback+0x77c b9b26500 805204ca 00000050 f000eef3 00000000 nt!KeBugCheckEx+0x1b b9b26568 8054478c 00000000 f000eef3 00000000 nt!MmTrimAllSystemPagableMemory+0x6c80 b9b26590 b90a7f9e 8a5a2350 00064440 b9b265a8 nt!Kei386EoiHelper+0x26f0 b9b26600 b91fbf02 8a252000 b9b269a8 b9b26ba8 igxpmp32+0x1df9e b9b268e4 b919bf85 8a252000 b9b26ac8 b9b2690c igxpmp32+0x171f02 b9b269c0 b9195f77 8a523000 0000000b 00000000 igxpmp32+0x111f85 b9b269f8 b9195218 8a523000 0000000b 00000000 igxpmp32+0x10bf77 b9b26a2c b9180b6c 8a523000 00000000 b9b26a80 igxpmp32+0x10b218 b9b26b38 b9127c08 8a559490 b9b26fb4 b9b26d6c igxpmp32+0xf6b6c b9b26e5c b911c5f5 8a452008 b9b26fb4 00000000 igxpmp32+0x9dc08 b9b26e70 b9120e4c 8a3f5640 b9b26fb4 8a532008 igxpmp32+0x925f5 b9b26e88 b90c0271 8a5a2350 b9b26fb4 00232018 igxpmp32+0x96e4c b9b273a4 b9097e30 8a5a2350 8a57bc98 00000000 igxpmp32+0x36271 b9b273c0 b9092895 8a5a2350 b9b27674 00232018 igxpmp32+0xde30 b9b27644 b909049b 8a5a2350 b9b27674 00000000 igxpmp32+0x8895 b9b27658 b908427b 8a5a2350 b9b27674 0000002c igxpmp32+0x649b b9b2771c 804ef1fd 8a5a2038 8a2d22d8 00000004 VIDEOPRT!VideoPortUnmapMemory+0x1441 b9b2775c bf8b61c3 8a5a2038 00232018 b9b277d0 nt!IoBuildPartialMdl+0xed b9b27780 be83091b 8a5a2038 00232018 b9b277d0 win32k!EngDeviceIoControl+0x1f b9b277a8 be83658f 8a5a2038 00232018 b9b277d0 igxpgd32+0xb91b b9b27810 be83662d 8a2aa000 8a2aa04c b9b278a8 igxpgd32!GfxDebugPrint+0x139f b9b2783c be83db8b 8a2aa000 b9b278a8 8a2aa0ac igxpgd32!GfxDebugPrint+0x143d b9b27870 be83d357 e18e2b20 00000001 b9b278a8 igxpgd32!GetSemaphoreHookedFlags+0x38cb b9b2795c be837236 e18e2b20 00000001 be7f0150 igxpgd32!GetSemaphoreHookedFlags+0x3097 b9b279b4 be843736 e18e2b20 e18e2b20 00000000 igxpgd32!DrvEnableDriver+0x5a6 b9b279c8 be818c29 e18e2b20 bf8a8f6c 00000000 igxpgd32!OsFreeMem+0x3ba6 b9b279f8 bf8a8f9e e18e2b20 bf8a8f6c b9b27a9c igxprd32+0x6c29 b9b27a30 bf90bc7a e18e2b20 e1661cb8 e18e0240 win32k!EngQueryPerformanceFrequency+0x2062 b9b27a50 bf8a6c43 b9b27bf0 e17a92c0 00000000 win32k!EngGetCurrentProcessId+0x74d6 b9b27a7c bf8a7623 e17a92c0 e1661cb0 e1830660 win32k!EngLoadImage+0x1b91 b9b27bf4 bf8ad841 00000000 00000000 00000001 win32k!EngQueryPerformanceFrequency+0x6e7 b9b27ce8 bf8aa16c 00000000 00000000 00000000 win32k!EngFreeModule+0x1ba0 b9b27d28 bf8aa0da 00000001 b9b27d64 0015fd98 win32k!EngQuerySystemAttribute+0x1143 b9b27d48 bf8ab620 b9b27d64 80541818 00050000 win32k!EngQuerySystemAttribute+0x10b1 b9b27d50 80541818 00050000 00000060 00000064 win32k!EngFindResource+0x399 b9b27da0 7eb41db9 00000000 00000001 ffffffff nt!KeReleaseInStackQueuedSpinLockFromDpcLevel+0xb80 b9b27dd8 00000000 00000000 00000000 00000000 ntdll!RtlGetFullPathName_UstrEx+0x1f STACK_COMMAND: kb FOLLOWUP_IP: igxpmp32+1df9e b90a7f9e 8b45fc mov eax,dword ptr [ebp-4] SYMBOL_STACK_INDEX: 5 SYMBOL_NAME: igxpmp32+1df9e FOLLOWUP_NAME: MachineOwner MODULE_NAME: igxpmp32 IMAGE_NAME: igxpmp32.sys BUCKET_ID: WRONG_SYMBOLS FAILURE_BUCKET_ID: WRONG_SYMBOLS ANALYSIS_SOURCE: KM FAILURE_ID_HASH_STRING: km:wrong_symbols FAILURE_ID_HASH: {70b057e8-2462-896f-28e7-ac72d4d365f8} Followup: MachineOwner --------- 0: kd> !analyze -v ******************************************************************************* * * * Bugcheck Analysis * * * ******************************************************************************* PAGE_FAULT_IN_NONPAGED_AREA (50) Invalid system memory was referenced. This cannot be protected by try-except, it must be protected by a Probe. Typically the address is just plain bad or it is pointing at freed memory. Arguments: Arg1: f000eef3, memory referenced. Arg2: 00000000, value 0 = read operation, 1 = write operation. Arg3: f000eef3, If non-zero, the instruction address which referenced the bad memory address. Arg4: 00000002, (reserved) Debugging Details: ------------------ ***** Kernel symbols are WRONG. Please fix symbols to do analysis. ************************************************************************* *** *** *** *** *** Your debugger is not using the correct symbols *** *** *** *** In order for this command to work properly, your symbol path *** *** must point to .pdb files that have full type information. *** *** *** *** Certain .pdb files (such as the public OS symbols) do not *** *** contain the required information. Contact the group that *** *** provided you with these symbols if you need this command to *** *** work. *** *** *** *** Type referenced: nt!_KPRCB *** *** *** ************************************************************************* ************************************************************************* *** *** *** *** *** Your debugger is not using the correct symbols *** *** *** *** In order for this command to work properly, your symbol path *** *** must point to .pdb files that have full type information. *** *** *** *** Certain .pdb files (such as the public OS symbols) do not *** *** contain the required information. Contact the group that *** *** provided you with these symbols if you need this command to *** *** work. *** *** *** *** Type referenced: nt!_KPRCB *** *** *** ************************************************************************* ADDITIONAL_DEBUG_TEXT: You can run '.symfix; .reload' to try to fix the symbol path and load symbols. FAULTING_MODULE: 804d7000 nt DEBUG_FLR_IMAGE_TIMESTAMP: 52491c0a READ_ADDRESS: f000eef3 FAULTING_IP: +21fd860021fd880 f000eef3 ?? ??? MM_INTERNAL_CODE: 2 DEFAULT_BUCKET_ID: DRIVER_FAULT BUGCHECK_STR: 0x50 ANALYSIS_VERSION: 6.3.9600.17237 (debuggers(dbg).140716-0327) x86fre LAST_CONTROL_TRANSFER: from 804f9a80 to 8052b724 FAILED_INSTRUCTION_ADDRESS: +21fd860021fd880 f000eef3 ?? ??? STACK_TEXT: WARNING: Stack unwind information not available. Following frames may be wrong. b9b26100 804f9a80 00000003 c0603c00 c0780070 nt!DbgBreakPointWithStatus+0x4 b9b264e0 804f9fcf 00000050 f000eef3 00000000 nt!KeRegisterBugCheckReasonCallback+0x77c b9b26500 805204ca 00000050 f000eef3 00000000 nt!KeBugCheckEx+0x1b b9b26568 8054478c 00000000 f000eef3 00000000 nt!MmTrimAllSystemPagableMemory+0x6c80 b9b26590 b90a7f9e 8a5a2350 00064440 b9b265a8 nt!Kei386EoiHelper+0x26f0 b9b26600 b91fbf02 8a252000 b9b269a8 b9b26ba8 igxpmp32+0x1df9e b9b268e4 b919bf85 8a252000 b9b26ac8 b9b2690c igxpmp32+0x171f02 b9b269c0 b9195f77 8a523000 0000000b 00000000 igxpmp32+0x111f85 b9b269f8 b9195218 8a523000 0000000b 00000000 igxpmp32+0x10bf77 b9b26a2c b9180b6c 8a523000 00000000 b9b26a80 igxpmp32+0x10b218 b9b26b38 b9127c08 8a559490 b9b26fb4 b9b26d6c igxpmp32+0xf6b6c b9b26e5c b911c5f5 8a452008 b9b26fb4 00000000 igxpmp32+0x9dc08 b9b26e70 b9120e4c 8a3f5640 b9b26fb4 8a532008 igxpmp32+0x925f5 b9b26e88 b90c0271 8a5a2350 b9b26fb4 00232018 igxpmp32+0x96e4c b9b273a4 b9097e30 8a5a2350 8a57bc98 00000000 igxpmp32+0x36271 b9b273c0 b9092895 8a5a2350 b9b27674 00232018 igxpmp32+0xde30 b9b27644 b909049b 8a5a2350 b9b27674 00000000 igxpmp32+0x8895 b9b27658 b908427b 8a5a2350 b9b27674 0000002c igxpmp32+0x649b b9b2771c 804ef1fd 8a5a2038 8a2d22d8 00000004 VIDEOPRT!VideoPortUnmapMemory+0x1441 b9b2775c bf8b61c3 8a5a2038 00232018 b9b277d0 nt!IoBuildPartialMdl+0xed b9b27780 be83091b 8a5a2038 00232018 b9b277d0 win32k!EngDeviceIoControl+0x1f b9b277a8 be83658f 8a5a2038 00232018 b9b277d0 igxpgd32+0xb91b b9b27810 be83662d 8a2aa000 8a2aa04c b9b278a8 igxpgd32!GfxDebugPrint+0x139f b9b2783c be83db8b 8a2aa000 b9b278a8 8a2aa0ac igxpgd32!GfxDebugPrint+0x143d b9b27870 be83d357 e18e2b20 00000001 b9b278a8 igxpgd32!GetSemaphoreHookedFlags+0x38cb b9b2795c be837236 e18e2b20 00000001 be7f0150 igxpgd32!GetSemaphoreHookedFlags+0x3097 b9b279b4 be843736 e18e2b20 e18e2b20 00000000 igxpgd32!DrvEnableDriver+0x5a6 b9b279c8 be818c29 e18e2b20 bf8a8f6c 00000000 igxpgd32!OsFreeMem+0x3ba6 b9b279f8 bf8a8f9e e18e2b20 bf8a8f6c b9b27a9c igxprd32+0x6c29 b9b27a30 bf90bc7a e18e2b20 e1661cb8 e18e0240 win32k!EngQueryPerformanceFrequency+0x2062 b9b27a50 bf8a6c43 b9b27bf0 e17a92c0 00000000 win32k!EngGetCurrentProcessId+0x74d6 b9b27a7c bf8a7623 e17a92c0 e1661cb0 e1830660 win32k!EngLoadImage+0x1b91 b9b27bf4 bf8ad841 00000000 00000000 00000001 win32k!EngQueryPerformanceFrequency+0x6e7 b9b27ce8 bf8aa16c 00000000 00000000 00000000 win32k!EngFreeModule+0x1ba0 b9b27d28 bf8aa0da 00000001 b9b27d64 0015fd98 win32k!EngQuerySystemAttribute+0x1143 b9b27d48 bf8ab620 b9b27d64 80541818 00050000 win32k!EngQuerySystemAttribute+0x10b1 b9b27d50 80541818 00050000 00000060 00000064 win32k!EngFindResource+0x399 b9b27da0 7eb41db9 00000000 00000001 ffffffff nt!KeReleaseInStackQueuedSpinLockFromDpcLevel+0xb80 b9b27dd8 00000000 00000000 00000000 00000000 ntdll!RtlGetFullPathName_UstrEx+0x1f STACK_COMMAND: kb FOLLOWUP_IP: igxpmp32+1df9e b90a7f9e 8b45fc mov eax,dword ptr [ebp-4] SYMBOL_STACK_INDEX: 5 SYMBOL_NAME: igxpmp32+1df9e FOLLOWUP_NAME: MachineOwner MODULE_NAME: igxpmp32 IMAGE_NAME: igxpmp32.sys BUCKET_ID: WRONG_SYMBOLS FAILURE_BUCKET_ID: WRONG_SYMBOLS ANALYSIS_SOURCE: KM FAILURE_ID_HASH_STRING: km:wrong_symbols FAILURE_ID_HASH: {70b057e8-2462-896f-28e7-ac72d4d365f8} Followup: MachineOwner ---------
-
@Damnation I am just installing Ramseys XP on the Panasonic CF-53 MK4. I check, that it has exact the same HD 4400 with DEV_0A16 as yours. Just now fun starts Dietmar
-
@Damnation Yes, tomorrow I make a run with Windbg Dietmar
-
@Damnation My Panasonic Notebook will come today or tomorrow. Of course I can help you with Windbg Dietmar
-
@Damnation Here comes next try, good luck Dietmar https://www.upload.ee/files/19631358/DEV_0A16_5445_OpenBSD79_STRICT_v5_F000_FIRMWARE_GUARDS.zip.html
-
@Damnation Here comes next try, good luck Dietmar https://www.upload.ee/files/19631358/DEV_0A16_5445_OpenBSD79_STRICT_v5_F000_FIRMWARE_GUARDS.zip.html
-
@Damnation Hi, I take the Source Code from OpenBSD 7.9 and look for the difference between the Desktop HD 4400 and the Ultra Low Power HD 4400 with DEV_0A16 in this Panasonic notebook. And I found. Here is a first try with the modded driver Intel 5445 Dietmar https://www.upload.ee/files/19629828/DEV_0A16_5445_OpenBSD79_STRICT_v4_LPTLP.zip.html
-
@Damnation I just bought this Panasonic at Ebay, but from Germany. It will be here in coming week and then fun starts Dietmar Comparison: Damnation's CF-53 Mk4 vs. my CF-53 Mk4 DAMNATION MINE MODEL CF-53 Mk4 CF-53 Mk4 CPU Intel Core i5-4310U Intel Core i5-4310U 2.0 GHz / 3.0 GHz Turbo 2.0 GHz / 3.0 GHz Turbo PLATFORM Haswell-U / ULT Haswell-U / ULT GRAPHICS Intel HD Graphics 4400 Intel HD Graphics 4400 GPU DEVICE ID DEV_0A16 DEV_0A16 DISPLAY 14" 14" 1366 × 768 1366 × 768 RAM 16 GB DDR3 4 GB DDR3 STORAGE 256 GB SSD 320 GB HDD WEBCAM No Yes / offered DVD Yes DVD Multi WLAN Yes Yes BLUETOOTH — Yes LAN Gigabit Ethernet Ethernet USB 3.0 2 2 USB 2.0 2 2 VGA Yes Yes HDMI Yes Yes RS-232 Yes Yes SELLER OS Windows 10 Pro Windows 10 Pro / Win 7 MARKET Canada Germany KEYBOARD North American German EBAY ITEM 256347295953 144515309431
-
@Damnation I make a try, just to fake the mobile GPU with its Desktop variant. Because both drivers are really different Dietmar https://www.upload.ee/files/19625445/Panasonic_CF53_HD4400_0A16_5445_binary_patch.zip.html
-
@Damnation It is a mistake. The industrial IEI WAFER-ULT-i1-i5 has no vga driver for XP Dietmar PS: Until now, I do not find a single board with VGA DEV_0A16 that works under XP SP3.
-
@Damnation Hi, now I am back from holidays. Are you still interested in to solve the video Bsod on the Panasonic Toughbook CF-53 Dietmar EDIT Panasonic CF-53 MK4 / HD 4400 DEV_0A16 – Finding the cause of XP BSOD 0x50 The Panasonic CF-53 MK4 with i5-4310U uses: Intel HD 4400 – DEV_0A16 An extremely important reference is the IEI WAFER-ULT-i1-i5, an industrial embedded board with i5-4300U. Intel confirms that the i5-4300U also contains: HD Graphics 4400 – Device ID 0x0A16 So this is essentially the same Haswell-ULT GPU as in the Panasonic. IEI explicitly provides a graphics driver installation for WAFER-ULT and documents the Intel graphics driver running on this platform; after installation it may select LVDS as primary output instead of VGA/HDMI. The WAFER-ULT documentation also explicitly covers Windows XP / XP Embedded. Therefore the IEI board is our most important reference for making DEV_0A16 work on the Panasonic. Important result from Intel 5445 The original Intel XP driver 6.14.10.5445 already contains: PCI\VEN_8086&DEV_0A16 -> iHSWGM0 So DEV_0A16 does NOT need an INF hack. igxpmp32.sys also contains routines for: DVMT / Stolen Memory GTT GGC/MGGC BAR / Graphics Aperture Intel OpRegion ACPI Main hypothesis: BIOS configuration The IEI BIOS offers explicit graphics-memory settings, including: DVMT Pre-Allocated = 32 / 64 / 128 / 256 / 512 MB Default = 256 MB The Panasonic BIOS may initialize DEV_0A16 differently. Therefore first compare/check: GGC BDSM BGSM GTT size DVMT/Stolen Memory BAR0 / BAR2 ASLS / OpRegion If possible, configure the Panasonic like the IEI board, especially 256 MB DVMT Pre-Allocated. WinDbg test Catch the Panasonic BSOD: !analyze -v .bugcheck r kv lmvm igxpmp32 !pci 1 For STOP 0x50 determine: Arg1 = bad address Arg3 = faulting instruction Then: ln <Arg3> u <Arg3-30> <Arg3+30> The main question is: Where does the invalid address come from? If it comes from: DVMT/Stolen Memory → fix BIOS setting or GetDVMTSettings GTT → patch GfxSetupGtt BAR0/BAR2/aperture → patch mapping/address calculation OpRegion → patch OpRegion handling ACPI resource → test NON-ACPI XP ULT-specific code → patch the DEV_0A16/iHSWGM0 initialization path ACPI test Test the same Panasonic: ACPI XP → 0x50 ? NON-ACPI XP → 0x50 ? Same crash/offset in both: → likely BIOS/DVMT/GTT or Haswell-ULT driver bug. NON-ACPI works: → likely ACPI/resource/OpRegion problem.
-
Oh waaaoh , this is the first time in years that ChatGPT works with Mypal under XP SP3. Only version 78.0.3 works and it is fast. Here is a small paper from me, that confirms the crazy crazy fact, that an classical particel fullfills exact(!) the same Heisenberg Unschärferelation Dietmar https://www.upload.ee/files/19496336/pxxp.pdf.html
-
@reboot12 Now I disabled ME, but this does not help. Now, after opening the Hidden Entries in Bios V92 of the Evga Dark z390 board, I can change such a lot of entries for the 9560 Wlan card. But nothing helps, the symptoms are to 100% the same as before. So now I think, that for sure the scan is not ok. I think about to build a brandnew driver for the 9560 on gemini chipset with j4105 and Cannon Lake on the really nice Dark board. But in first place I make a try to keep everything from the Windows site, for example the scan, from the working m135 driver. Just change Firmware 77 ==> 46 and some more. But I doubt, that this will work. Only brandnew driver gives a real new chance Dietmar